Organizations investing in AI tools need clear, measurable indicators to track success and justify continued investment. Without proper metrics, companies risk misallocating resources or missing opportunities to optimize their AI implementations.
This guide provides a comprehensive framework for defining and measuring AI tool success across technical, business, and user experience dimensions.
Why AI Metrics Matter More Than Ever
The rapid adoption of AI tools across industries creates an urgent need for standardized success measurement. Companies face several challenges:
- Investment Justification: Leadership requires concrete data showing AI tool effectiveness
- Performance Optimization: Teams need metrics to identify improvement areas
- Resource Allocation: Budgets depend on demonstrable value creation
- Risk Management: Metrics help identify potential issues before they escalate
Understanding which metrics to track—and how to interpret them—determines whether AI initiatives succeed or fail.
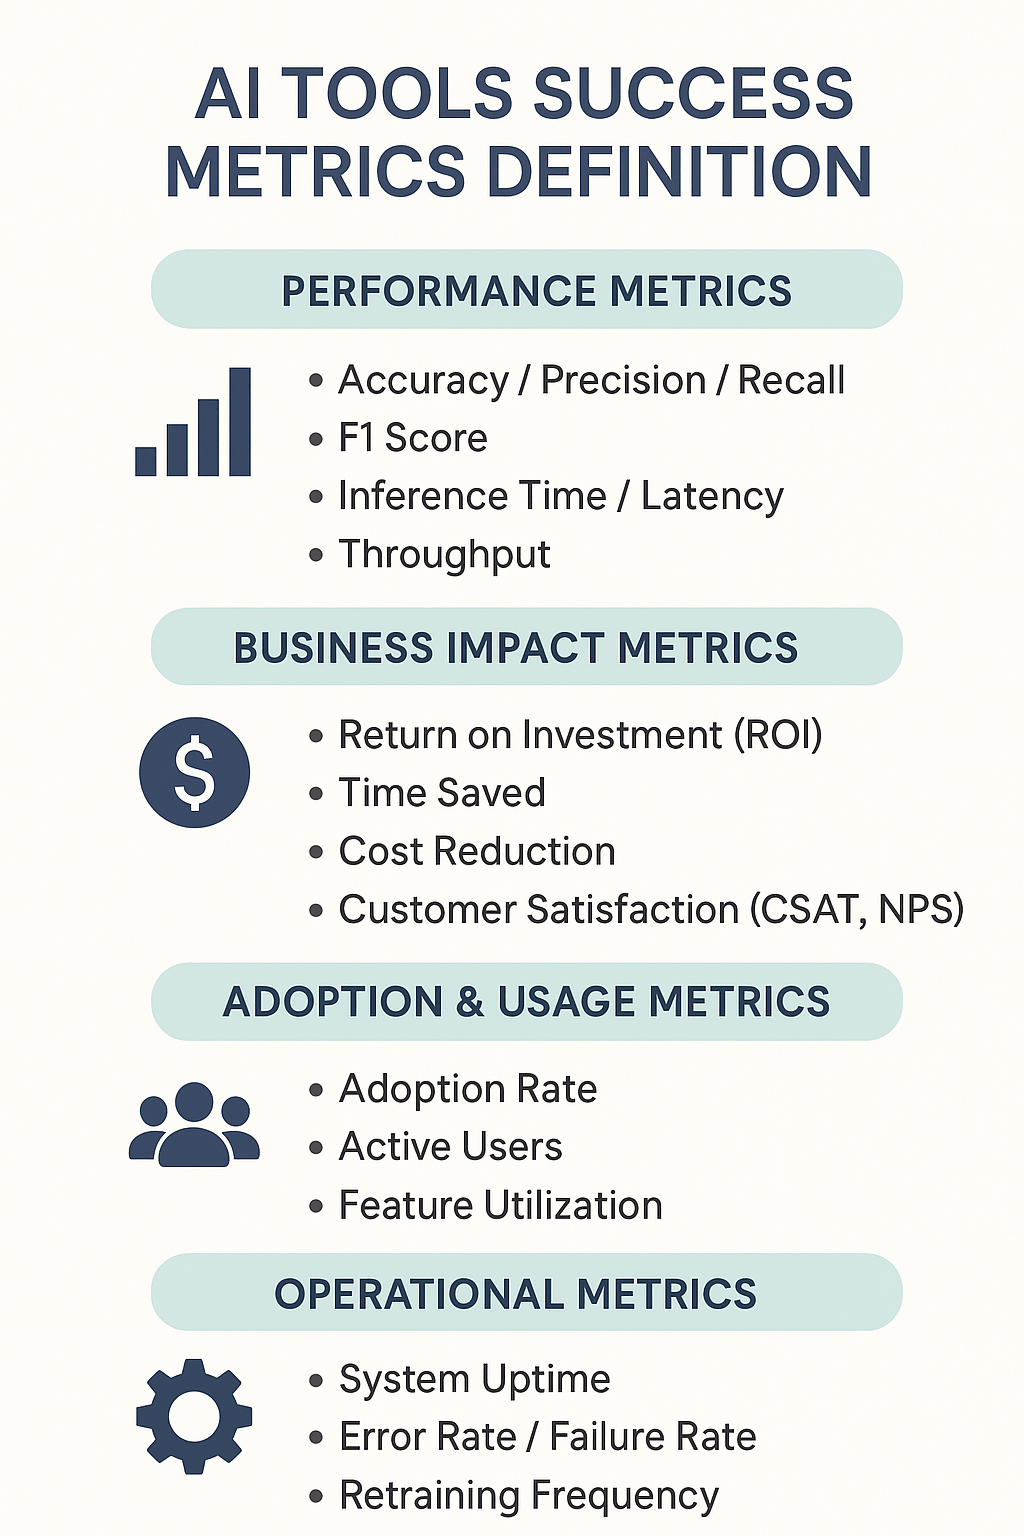
Core Performance Metrics
Accuracy and Precision
Fundamental metrics measuring AI tool effectiveness:
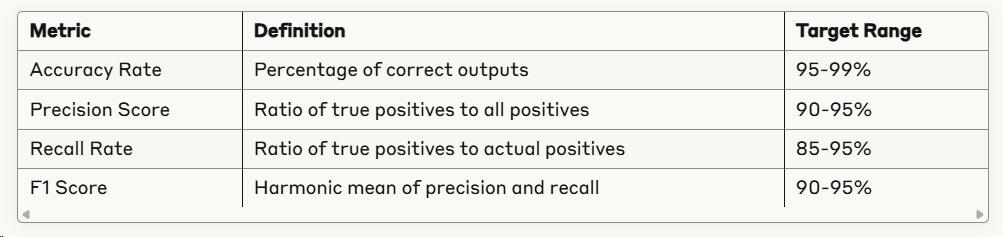
Implementation Tips:
- Establish baseline accuracy before AI deployment
- Track improvements over time
- Compare against human performance benchmarks
- Adjust targets based on use case criticality
Response Time and Latency
Speed metrics critical for user experience:
Key Measurements:
- Average response time (milliseconds)
- 95th percentile latency
- Time to first byte
- Processing queue length
Performance Standards:
- Real-time applications: < 100ms
- Interactive tools: < 500ms
- Batch processing: < 5 seconds
- Complex analyses: < 30 seconds
Throughput and Scalability
Capacity metrics for enterprise deployments:
- Requests per second
- Current capacity
- Peak load handling
- Degradation thresholds
- Concurrent users
- Maximum supported
- Performance impact curves
- Resource scaling requirements
- Data processing volume
- Records per hour
- File size limitations
- Batch processing capacity
Business Impact Metrics
Return on Investment (ROI)
Financial metrics demonstrating value:
ROI Calculation Formula:
ROI = (Gain from Investment - Cost of Investment) / Cost of Investment × 100Components to Track:
- Initial implementation costs
- Ongoing operational expenses
- Revenue increases
- Cost savings achieved
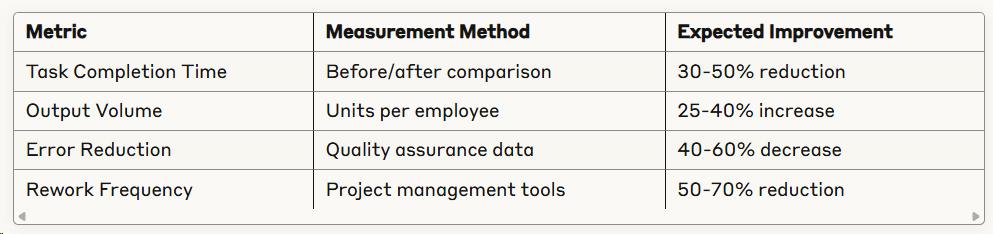
Productivity Gains
Efficiency improvements across teams:
Cost Reduction Analysis
Direct and indirect savings:
Direct Savings:
- Reduced manual labor hours
- Lower error correction costs
- Decreased training expenses
- Minimized downtime losses
Indirect Benefits:
- Improved employee retention
- Enhanced customer satisfaction
- Accelerated innovation cycles
- Reduced compliance risks
User Adoption Metrics
Active User Rates
Tracking actual tool utilization:
Daily Active Users (DAU)
- Login frequency
- Feature interaction
- Session duration
- Task completion
Monthly Active Users (MAU)
- Retention rates
- Growth trends
- Department penetration
- Role-based adoption
Feature Utilization Analysis
Understanding which capabilities deliver value:
- Core Feature Usage
- Primary function adoption (%)
- Advanced feature exploration
- Custom configuration rates
- Integration activation
- Usage Patterns
- Peak usage times
- Workflow sequences
- Feature combinations
- Abandonment points
Engagement Scoring
Comprehensive user interaction measurement:
Engagement Formula:
Engagement Score = (Feature Usage × Frequency × Duration) / Total Available FeaturesTarget engagement levels:
- Power users: 80-100%
- Regular users: 50-80%
- Occasional users: 20-50%
- At-risk users: < 20%
Quality and Accuracy Metrics
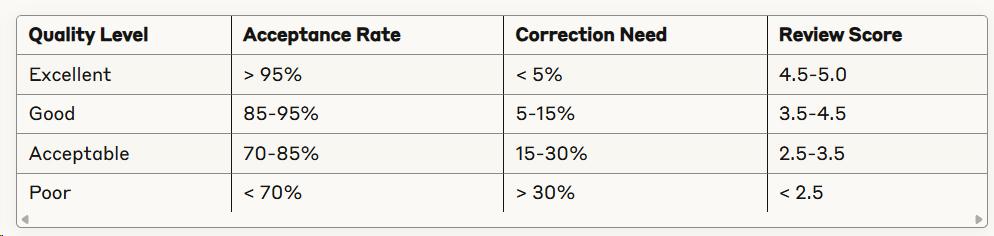
Output Quality Assessment
Measuring AI-generated content effectiveness:
Quality Indicators:
- Acceptance rate of suggestions
- Manual correction frequency
- Peer review scores
- Customer feedback ratings
Quality Scoring Matrix:
Error Detection Effectiveness
Preventing problems before they occur:
- False positive rate
- False negative rate
- Detection accuracy
- Alert precision
Operational Excellence Metrics
System Reliability
Uptime and availability measurements:
Standard Targets:
- Enterprise SLA: 99.9% uptime
- Mission-critical: 99.99% uptime
- Development/testing: 99% uptime
Reliability Components:
- Mean time between failures (MTBF)
- Mean time to recovery (MTTR)
- Error rate per transaction
- System response consistency
Resource Utilization
Efficiency of computational resources:
- CPU Usage
- Average utilization
- Peak load handling
- Idle time percentage
- Memory Consumption
- RAM allocation
- Cache hit rates
- Garbage collection frequency
- Storage Metrics
- Data growth rate
- Compression ratios
- Archive efficiency
Employee Satisfaction Metrics
User Satisfaction Scoring
Regular feedback collection:
Survey Components:
- Tool effectiveness rating
- Ease of use assessment
- Feature satisfaction levels
- Support quality evaluation
Net Promoter Score (NPS):
NPS = % Promoters - % DetractorsTarget NPS ranges:
- Excellent: > 50
- Good: 30-50
- Acceptable: 0-30
- Poor: < 0
Workflow Efficiency Ratings
Impact on daily operations:
Measurement Areas:
- Task completion speed
- Process simplification
- Decision-making improvement
- Collaboration enhancement
Security and Compliance Metrics
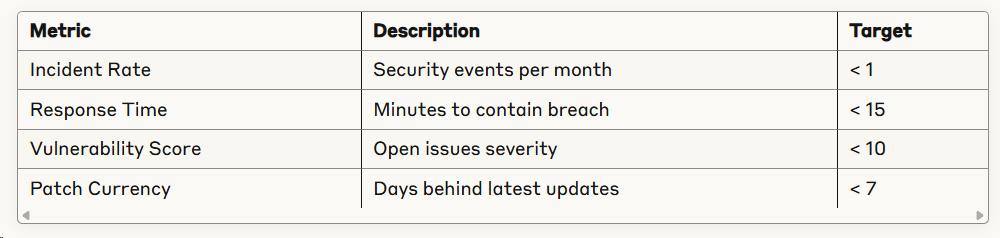
Security Performance Indicators
Protecting sensitive data:
Compliance Adherence
Meeting regulatory requirements:
Compliance Checklist:
- Data privacy regulations (GDPR, CCPA)
- Industry standards (SOC2, ISO 27001)
- Internal policies alignment
- Audit finding resolution rate
Implementation Strategy
Establishing Baselines
Critical first steps:
- Pre-deployment Assessment
- Current performance levels
- Manual process metrics
- Cost structures
- Quality benchmarks
- Pilot Program Metrics
- Limited scope testing
- Controlled environment results
- User feedback collection
- Technical performance data
Creating Dashboards
Effective metric visualization:
Dashboard Components:
- Real-time performance indicators
- Trend analysis charts
- Alert threshold monitoring
- Comparative analytics
Stakeholder Views:
- Executive summary dashboard
- Technical operations panel
- User adoption tracker
- Financial impact report
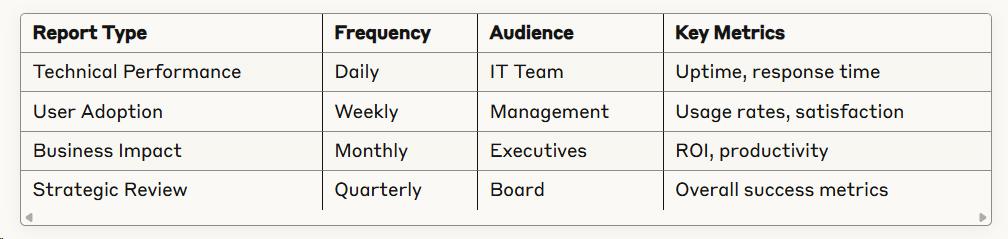
Reporting Cadence
Communication schedule:
Action Plan Development
Converting metrics into improvements:
- Identify Gaps
- Performance below targets
- User adoption challenges
- Quality issues
- Cost overruns
- Prioritize Actions
- Impact assessment
- Resource requirements
- Timeline feasibility
- Risk evaluation
- Implement Changes
- Process adjustments
- Training programs
- Technical optimizations
- Policy updates
- Monitor Results
- Track improvements
- Adjust strategies
- Document learnings
- Share best practices
Best Practices for Metric Success
Metric Selection Guidelines
Choose metrics that are:
- Specific: Clearly defined and measurable
- Actionable: Drive behavior changes
- Relevant: Align with business goals
- Timely: Available when needed
Common Pitfalls to Avoid
- Metric Overload
- Focus on 5-7 key indicators
- Avoid vanity metrics
- Prioritize actionable data
- Static Targets
- Review goals quarterly
- Adjust for market changes
- Account for tool maturity
- Siloed Measurement
- Share metrics across teams
- Connect technical and business KPIs
- Foster collaborative improvement
Conclusion
Success metrics for AI tools require careful definition, consistent measurement, and regular refinement. Organizations that establish comprehensive metric frameworks position themselves to maximize AI investments while minimizing risks.
Key Success Factors:
- Balance technical and business metrics
- Focus on user adoption and satisfaction
- Maintain security and compliance standards
- Create actionable reporting structures
- Commit to continuous improvement
Start by selecting 3-5 core metrics aligned with your primary objectives. Expand measurement capabilities as your AI maturity grows. Remember: what gets measured gets managed—and what gets managed gets improved.
Transform your AI tool investments from experimental initiatives into measurable business advantages through strategic metric implementation.
Unlock your AI Edge — Free Content Creation Checklist
Get the exact AI-powered process to 10X your content output — blogs, emails, videos, and more — in half the time.
No fluff. No spam. Just real results with AI.