Tired of static charts that fail to tell the complete story?
AI-powered visualization tools now transform complex datasets into interactive experiences that reveal hidden patterns and drive better decisions. This guide breaks down the top tools, their specific strengths, and how to implement them for maximum impact.
Why Traditional Visualization Falls Short
Standard charts and graphs limit understanding in critical ways:
- They show only one data perspective at a time
- Users can’t explore relationships between variables
- Complex patterns remain hidden beneath aggregated data
- Non-technical team members struggle to extract insights
AI visualization tools solve these exact problems.
Top AI Visualization Tools Worth Your Attention
1. Tableau with Einstein Discovery
What it does: Combines Tableau’s visualization capabilities with AI-powered insight generation.
Price point: From $70/user/month for Tableau Creator with Einstein
Best for: Enterprises with complex data needs requiring both depth and accessibility
2. Power BI with AI Insights
What it does: Microsoft’s visualization platform with integrated machine learning capabilities.
Price point: From $9.99/user/month (Power BI Pro)
Best for: Organizations already using Microsoft ecosystem
3. Plotly Dash
What it does: Creates interactive web applications for data visualization with AI enhancement.
Price point: Open source core with enterprise pricing available
Best for: Data science teams needing customizable visualization solutions
4. Observable
What it does: JavaScript-based interactive notebooks with AI-assisted visualization creation.
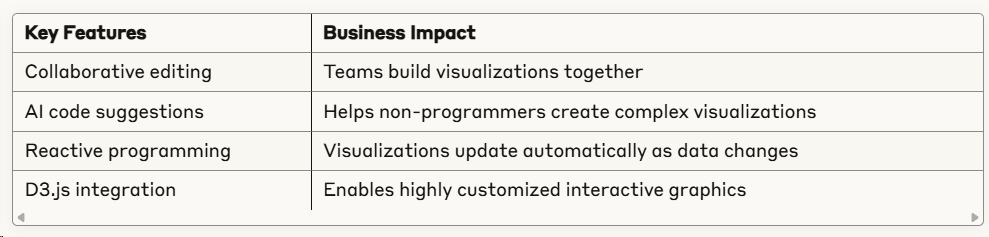
Price point: Free tier available, teams from $12/user/month
Best for: Organizations needing highly customized visualizations with collaborative workflows
5. ThoughtSpot
What it does: Search-driven analytics platform with AI-powered visualization.
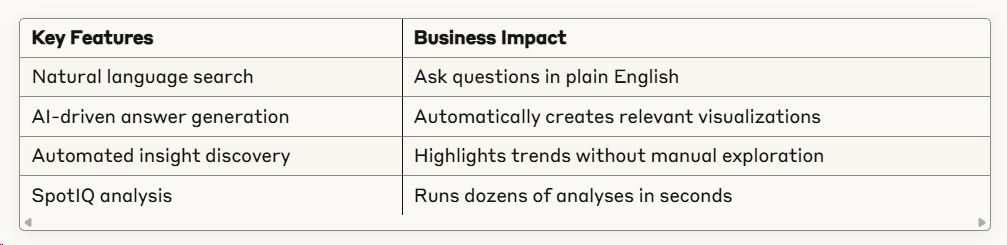
Price point: Custom pricing, typically $24-$48/user/month
Best for: Organizations prioritizing ease of use for non-technical users
Implementation Roadmap: 5 Steps to Success
1. Audit Your Data Ecosystem (1-2 Weeks)
- Inventory existing data sources and formats
- Identify integration requirements
- Assess data quality and cleaning needs
2. Define Clear Use Cases (1 Week)
- Identify specific business questions to answer
- Determine key decision points that need data
- Map stakeholder visualization needs
3. Tool Selection and Testing (2-3 Weeks)
- Evaluate 2-3 tools against your specific requirements
- Run pilot projects with actual datasets
- Gather feedback from technical and non-technical users
4. Deployment and Training (3-4 Weeks)
- Integrate with existing data infrastructure
- Create initial visualization templates
- Develop training programs for different user types
5. Measure and Iterate (Ongoing)
- Track usage statistics and insight generation
- Collect user feedback systematically
- Implement regular enhancement cycles
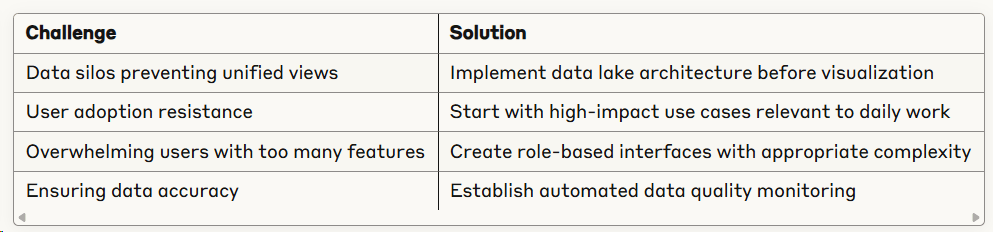
Common Implementation Challenges
Case Study: Manufacturing Company Transformation
A mid-sized manufacturing company implemented ThoughtSpot for production analytics:
Starting point:
- 2+ days to generate production efficiency reports
- Department silos with inconsistent metrics
- Management decisions based on outdated information
AI visualization implementation:
- Connected 12 data sources into unified platform
- Created interactive dashboards for different user roles
- Implemented natural language querying for non-technical staff
Results after 3 months:
- Real-time production analytics available to all teams
- 27% improvement in production efficiency
- Decision-making time reduced from days to minutes
- $1.2M in identified cost savings from pattern detection
Key success factor: They focused initial deployment on solving specific pain points rather than building comprehensive dashboards.
The Business Impact: 5 Key Benefits
- Faster Decision-Making
- 73% reduction in time from data to decision
- Elimination of report preparation bottlenecks
- Deeper Insights
- 40% more identified opportunities compared to traditional methods
- Pattern detection revealing previously hidden relationships
- Broader Data Access
- 3.5× increase in employees actively using data
- Democratization of insights beyond analyst teams
- Higher Quality Decisions
- 35% improvement in forecast accuracy
- Reduced cognitive bias through automated pattern detection
- Increased Collaboration
- 68% increase in cross-departmental data sharing
- Common visual language for discussing business performance
Advanced AI Visualization Capabilities
The most sophisticated tools now offer capabilities that transform how organizations use data:
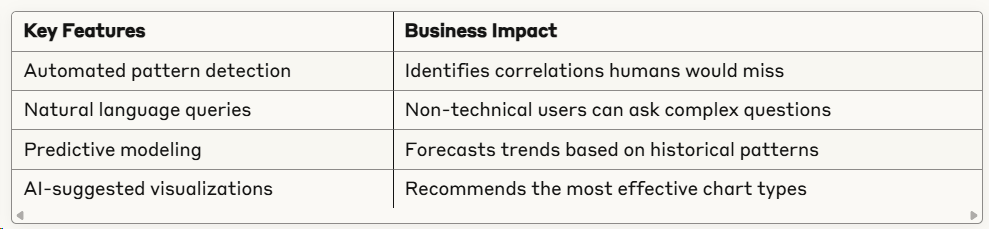
Augmented Analytics
AI identifies patterns, anomalies, and insights without manual exploration, then suggests the most effective visualization methods to display them.
Natural Language Interfaces
Users ask questions in plain English like “Show me sales trends by region for the last six months compared to forecast,” and the AI generates appropriate visualizations.
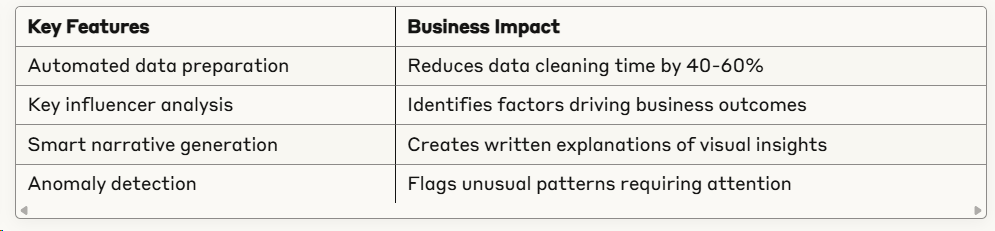
Automated Narrative Generation
AI creates written explanations alongside visualizations, explaining key points, unusual patterns, and business implications.
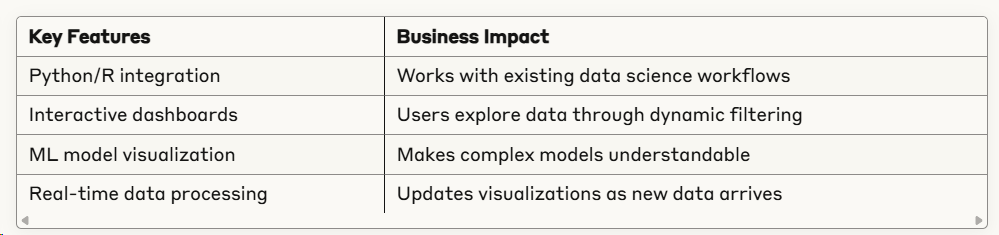
Predictive Visualization
Shows not just what happened and why, but what’s likely to happen next based on historical patterns and machine learning models.
Getting Started: Next Steps
- Identify your visualization pain points
- Where do current visualizations fail to deliver insights?
- Which decisions lack adequate data support?
- Assess your organization’s technical readiness
- Data integration capabilities
- User technical skills
- IT support resources
- Start with a targeted proof of concept
- Choose a high-value business problem
- Select 1-2 tools for comparison
- Measure concrete outcomes
- Build an implementation roadmap
- Prioritize use cases by business impact
- Develop a phased rollout plan
- Create training and adoption strategies
The organizations seeing the greatest ROI from AI visualization tools focus not on the technology itself but on the business problems it solves. Start with clear objectives, choose tools that match your specific needs, and measure impact consistently to ensure these powerful tools deliver meaningful business value.
Unlock your AI Edge — Free Content Creation Checklist
Get the exact AI-powered process to 10X your content output — blogs, emails, videos, and more — in half the time.
No fluff. No spam. Just real results with AI.